
Happy Independence Day, and a historic happy 250th birthday to the United States of America!
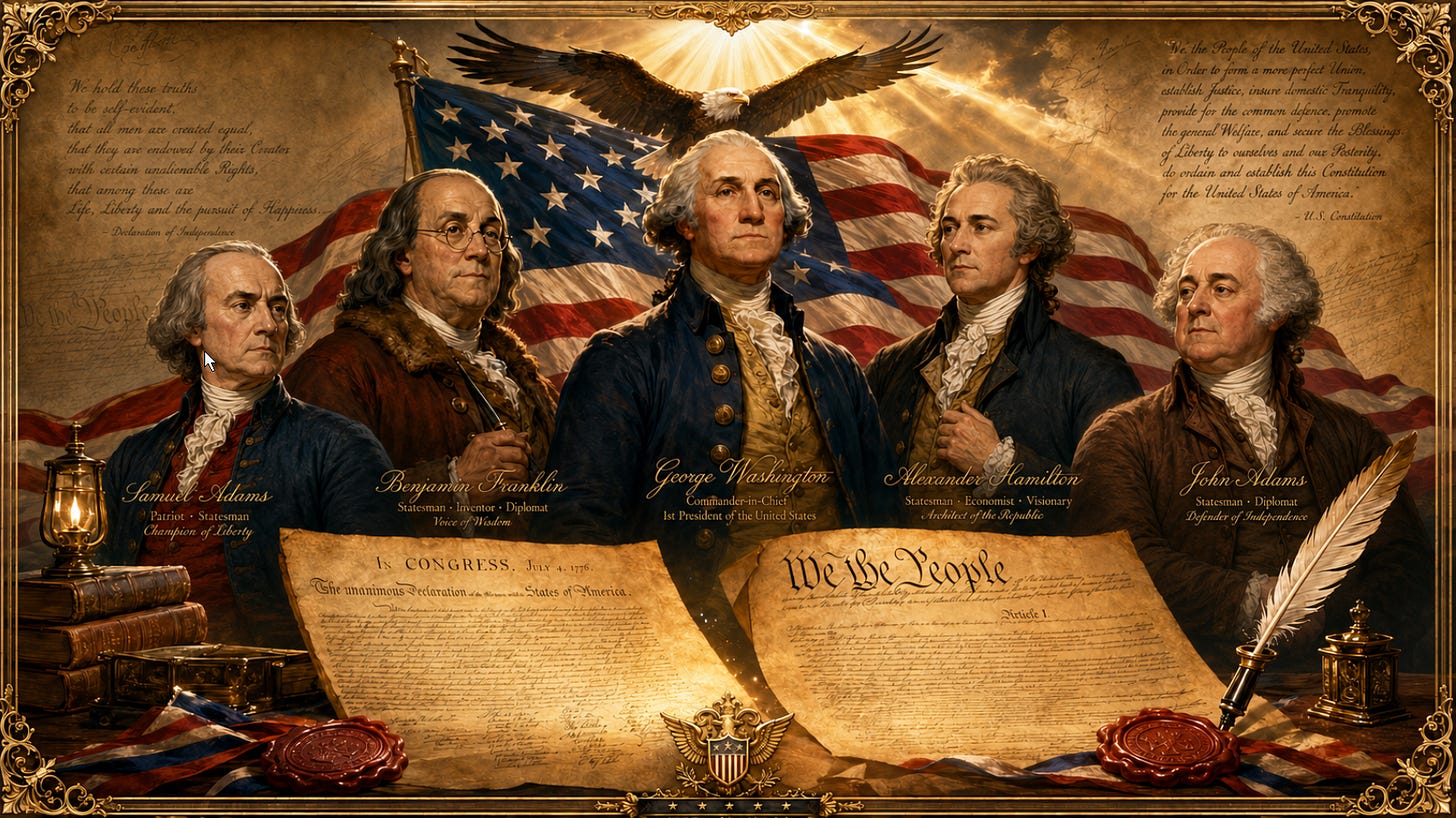
Today, July 4, 2026, we celebrate a nation built on the foundational truth that our fundamental rights are granted by God, not by government. Throughout our history, the American story has been carried forward by leaders and patriots who understood that liberty is always worth defending from the Founding Fathers and Abraham Lincoln to Frederick Douglass, Booker T. Washington, Dwight D. Eisenhower, Douglas MacArthur, George S. Patton, Chester W. Nimitz, Ronald Reagan, President Donald J. Trump, and Charlie Kirk.
While America is not perfect, she is profoundly worth loving, protecting, and preserving for the next generation. God has uniquely used this nation to shatter tyranny, champion global freedom, and carry the Gospel to every corner of the earth. Today, we offer our gratitude to God for this country, honor the heroes who built and defended her, and firmly recommit ourselves to faith, family, and freedom.
Below is an exhaustive list of 250 distinct reasons (though we easily could have listed thousands more) why the United States stands as the greatest nation to ever exist. To show the full scope of the American experiment, these reasons are organized across five critical dimensions, highlighting the tangible impacts, institutional brilliance, and lasting consequences of American liberty, power, prosperity, innovation, and global reach.
250 Strict Constructionist Reasons the United States Is the Greatest Nation to Ever Exist
I. Founding Principles, Natural Rights, and the American Creed
The United States is the greatest nation because it made the truth of God-given, unalienable individual rights the central moral claim of its founding.
The Declaration of Independence teaches that rights come from the Creator, not from kings, legislatures, courts, presidents, or bureaucracies.
America was founded on the principle that government exists to secure pre-existing rights, not to create or ration them.
The Founders grounded political legitimacy in the consent of the governed.
The United States rejected monarchy and hereditary rule in favor of republican self-government.
America’s founding creed placed the individual person above the state.
The American Revolution was not merely a rebellion against taxes; it was a defense of lawful liberty against arbitrary power.
The Declaration supplied the moral foundation for the Constitution’s legal structure.
The Constitution translated the principles of liberty into a durable system of government.
America created a written Constitution so that government would be bound by fixed law.
The Constitution is supreme over ordinary politics, temporary majorities, and public officials.
The American system assumes that power must be restrained because human nature is imperfect.
The Founders understood that liberty requires virtue, self-discipline, religion, family, and civic duty.
America’s founding rejected the idea that citizens are subjects of government.
The American people are sovereign; public officials are agents with delegated authority.
The Constitution protects liberty by limiting government first.
The United States made ordered liberty, not lawless license, the goal of republican government.
America’s founding principles are universal in moral truth but national in constitutional application.
The American creed allows people from many backgrounds to become one people through allegiance to shared principles.
The Founders did not create a perfect society, but they gave the nation principles capable of judging and correcting injustice.
The United States became exceptional because its founding documents provide a standard above political convenience.
America’s greatness rests on the proposition that no ruler is above the law.
America’s constitutional order made freedom practical by giving it institutional form.
The United States proved that liberty could be secured across a vast republic.
America’s founding remains unmatched because it joined natural rights, popular sovereignty, written law, and limited government in one enduring national order.
II. Constitutional Structure and Limited Government
The Constitution created a federal government of limited and enumerated powers.
The national government may exercise only those powers delegated to it by the Constitution.
The Tenth Amendment confirms that undelegated powers are reserved to the states or to the people.
Federalism protects liberty by dividing authority between national and state governments.
The states are constitutional actors, not mere administrative districts of Washington, D.C.
Local self-government allows communities to govern many matters close to home.
The Constitution separates legislative, executive, and judicial power to prevent tyranny.
Congress makes law; the President executes law; courts decide cases and controversies under law.
The separation of powers prevents one branch from becoming master of the others.
The Constitution’s checks and balances force deliberation before national power is exercised.
Bicameralism makes federal law harder to enact, which protects liberty from rash legislation.
The House of Representatives gives the people direct representation in federal lawmaking.
The Senate preserves the federal character of the Union.
The Electoral College reflects the Constitution’s federal design rather than simple national majoritarianism.
The President’s veto protects against unconstitutional, unwise, or hasty legislation.
Congressional control of appropriations keeps the public purse under elected representatives.
Congress, not the President alone, has the constitutional authority to declare war.
The Commander in Chief Clause allows energetic military leadership within constitutional bounds.
Impeachment provides a constitutional remedy for serious abuse of public trust.
The Constitution requires officeholders to swear allegiance to the Constitution, not to a ruler or party.
The amendment process allows lawful change without revolution.
The difficulty of amendment protects the Constitution from temporary passions.
Judicial review is legitimate when courts enforce the Constitution’s text and original meaning.
Judicial power becomes dangerous when judges substitute personal policy views for constitutional law.
The Constitution’s structure is one of America’s greatest achievements because it restrains power while allowing effective self-government.
III. The Bill of Rights, Rule of Law, and Civil Liberty
The Bill of Rights recognizes that some liberties are beyond the reach of ordinary government power.
The First Amendment protects speech because free citizens must be able to debate truth and criticize government.
Freedom of the press allows public scrutiny of officials.
Freedom of religion protects conscience from state coercion.
The Free Exercise Clause protects the right to live according to sincere religious conviction.
The Establishment Clause prevents a national church while preserving public religious liberty.
The right to assemble protects peaceful civic action.
The right to petition allows citizens to seek redress from government without violence.
The Second Amendment protects the right of the people to keep and bear arms.
The right to bear arms reflects both personal defense and the Founders’ distrust of concentrated coercive power.
The Third Amendment reflects America’s rejection of military domination over civilian life.
The Fourth Amendment protects the people against unreasonable searches and seizures.
The warrant requirement protects the home from arbitrary intrusion.
The Fifth Amendment protects life, liberty, and property through due process of law.
The Takings Clause prevents government from seizing private property without just compensation.
The privilege against self-incrimination restrains coercive prosecution.
Protection against double jeopardy limits government’s power to repeatedly prosecute.
The Sixth Amendment protects the accused through counsel, confrontation, public trial, and impartial jury.
Trial by jury places citizens between the individual and the state.
The Seventh Amendment preserves the civil jury as a guardian of private rights.
The Eighth Amendment limits excessive fines and cruel or unusual punishments.
The Ninth Amendment warns that enumerating certain rights does not deny others retained by the people.
The Tenth Amendment preserves the Constitution’s limited-government structure.
The rule of law protects citizens from arbitrary rule by officials.
America is great because its constitutional liberties are not merely policy preferences; they are legal barriers against government power.
IV. Ending Slavery, Equal Citizenship, and Constitutional Self-Correction
America’s founding principles created the moral standard by which slavery was ultimately condemned.
The contradiction between slavery and the Declaration’s principle of human equality became impossible to ignore.
The abolitionist movement drew strength from America’s founding claim that all men are created equal.
The Civil War tested whether a nation conceived in liberty could endure.
The Union victory preserved the constitutional republic.
The Thirteenth Amendment abolished slavery throughout the United States.
The Fourteenth Amendment placed national citizenship, due process, and equal protection into the constitutional text.
The Fifteenth Amendment forbade racial discrimination in voting rights.
The Reconstruction Amendments corrected grave injustice through constitutional amendment, not judicial invention.
America’s capacity for lawful self-correction is one of its greatest strengths.
The Constitution gave later generations tools to bring the country closer to its founding promises.
Equal protection under law reflects the equal moral worth of persons before God and law.
The abolition of slavery was one of the greatest moral achievements in American history.
The United States paid an immense cost in blood to preserve the Union and end slavery.
The postwar constitutional settlement rejected the idea that states may deny basic citizenship rights.
America’s civil rights progress is strongest when rooted in the Constitution’s text and amendments.
The rule of law allowed the nation to confront injustice without abandoning constitutional government.
The American promise of equality is equality of rights, not forced equality of outcomes.
The Constitution protects persons as individuals, not merely as members of groups.
America’s struggle against slavery shows that founding principles can outlive and defeat founding compromises.
The peaceful expansion of voting rights through amendment demonstrates lawful constitutional development.
The civil jury, due process, and equal protection became tools for vindicating individual rights.
America’s best reformers appealed to the Declaration and Constitution rather than rejecting them.
The United States is great not because it has never sinned, but because its founding principles provide the means to repent, correct, and improve.
The end of slavery proves that America’s founding promise was not empty rhetoric but a standard powerful enough to transform the nation.
V. Economic Liberty, Property Rights, and Entrepreneurial Power
America became an economic superpower because it protected property, contract, enterprise, and voluntary exchange.
Secure property rights allowed ordinary citizens to build independence.
The protection of private property limits dependence on government favor.
The Constitution’s Takings Clause protects ownership from uncompensated seizure.
The Contract Clause reflects the importance of stable legal obligations.
Patent and copyright protections encouraged invention and creative labor.
A vast internal market allowed Americans to trade across state lines under one constitutional Union.
The Constitution helped prevent states from waging economic warfare against one another.
Free enterprise rewarded innovation, risk, work, and discipline.
America’s economy grew because citizens could start businesses without hereditary permission.
The American system encouraged the self-made citizen.
Free labor became a defining principle of American prosperity.
American farms helped feed the nation and much of the world.
American industry turned resources, labor, and invention into unmatched productive power.
American railroads, factories, ports, and markets connected a continental republic.
American capitalism created wealth through production and exchange rather than conquest or caste.
Competition improved quality and lowered costs for ordinary people.
Prices and profit-and-loss signals coordinated human activity better than central planning.
The American system allowed failure, recovery, and reinvention.
Small businesses became engines of local independence and community strength.
Capital markets helped finance innovation, expansion, and enterprise.
America attracted immigrants because it offered opportunity under law.
Immigrant families helped build American agriculture, industry, science, culture, and commerce.
Private philanthropy flourished because wealth could be created and given voluntarily.
America’s economic greatness rests on liberty under law, not state control of human ambition.
VI. Science, Medicine, Technology, and Innovation
America’s constitutional liberty created room for scientific discovery and technological creativity.
American inventors helped bring practical electric light and power to modern civilization.
American innovation transformed communication through the telegraph, telephone, radio, television, and digital networks.
The Wright brothers launched the age of powered flight.
Henry Ford’s assembly-line production helped make automobiles affordable to ordinary citizens.
American industry made mass production a force for rising living standards.
Bell Labs’ transistor helped make the modern electronics revolution possible.
American semiconductor innovation helped create the digital age.
American computing placed extraordinary power in the hands of ordinary people.
The United States helped create and commercialize the modern internet.
American software and hardware transformed business, education, communication, and research.
GPS, developed through American defense and space capability, transformed navigation, logistics, agriculture, and daily life.
American medical researchers contributed greatly to antibiotics, vaccines, surgery, imaging, and biotechnology.
The polio vaccine stands among America’s most important gifts to humanity.
American pharmaceutical and medical-device innovation has saved and improved countless lives.
American hospitals, universities, laboratories, and private firms created a powerful research ecosystem.
The Human Genome Project demonstrated America’s leadership in large-scale scientific cooperation.
American biotechnology opened new paths for treating disease.
American agricultural science increased yields and helped fight hunger.
American engineering produced safer air travel, stronger infrastructure, and better communications.
American energy innovation strengthened national prosperity and security.
American computer science laid foundations for artificial intelligence, data systems, and modern automation.
American invention succeeded because free people were allowed to test, build, compete, and profit.
America’s scientific greatness reflects both private initiative and constitutionally authorized public support.
The United States has improved human life through discovery on a scale few civilizations have approached.
VII. Space, Exploration, Infrastructure, and National Achievement
America’s space program demonstrated the power of free citizens pursuing great national goals.
The Apollo program achieved the first human landing on the Moon.
The Moon landing showed the world that a constitutional republic could outcompete totalitarian central planning.
NASA’s achievements inspired generations in science, engineering, aviation, and exploration.
American astronauts became symbols of courage, discipline, and national purpose.
The Space Shuttle program expanded human spaceflight and orbital operations.
American satellites transformed weather forecasting, communications, defense, mapping, and navigation.
The United States helped make space a domain of scientific discovery and practical benefit.
American private enterprise later reduced the cost of reaching space through reusable rocket technology.
America’s space achievements joined national defense, science, and imagination.
The interstate highway system strengthened commerce, mobility, and national defense.
American aviation connected the continent and the world.
American ports, railroads, pipelines, and highways made the nation a logistical power.
American engineering helped build dams, bridges, airports, and energy systems of continental scale.
The United States became a nation capable of moving people, goods, information, and military power with unmatched speed.
American infrastructure reflected both state, local, private, and federal contributions.
The American spirit of exploration moved from frontier settlement to air, sea, space, and digital frontiers.
America’s achievements in aviation and space were made possible by education, industry, science, and national confidence.
American weather satellites and forecasting systems have saved lives around the world.
American communications satellites made global broadcasting and connectivity possible.
American mapping and navigation technologies improved farming, shipping, emergency response, and defense.
American exploration reflects a culture that refuses stagnation.
The United States repeatedly turned difficult frontiers into fields of discovery.
America’s space and infrastructure achievements show what free people can build when united by purpose.
The American record in exploration proves that liberty and greatness are not opposites but partners.
VIII. Military Power, National Defense, and the Fight Against Tyranny
The Constitution gives the federal government a central duty: to provide for the common defense.
America’s military power is legitimate when used to defend the nation, protect citizens, honor constitutional authority, and secure peace through strength.
American service members swear an oath to the Constitution, not to a monarch or dictator.
Civilian control of the military preserves republican government.
Congress’s war powers require national deliberation before war.
America’s entry into World War I helped tip the balance against imperial aggression in Europe.
World War I showed America’s industrial and military capacity on the world stage.
American sacrifice in World War I helped shape the modern era.
In World War II, American industry became the arsenal of freedom.
American soldiers, sailors, Marines, and airmen helped defeat Nazi Germany.
American power helped defeat Imperial Japan and end the war in the Pacific.
D-Day stands as one of the greatest military operations in history.
America helped liberate millions from fascist and imperial tyranny.
American victory in World War II prevented totalitarian powers from dominating the globe.
The United States used postwar strength to deter Soviet expansion.
America’s Cold War policy helped contain the spread of communism.
American resolve helped expose the economic and moral failure of communist systems.
The Berlin Airlift demonstrated American resistance to communist coercion.
NATO, when understood as collective defense among sovereign nations, helped deter Soviet aggression.
American support for South Korea helped preserve it from communist conquest.
The Korean War showed America’s willingness to resist armed communist expansion.
America’s involvement in Vietnam reflected the broader Cold War effort to resist communist expansion, while also teaching the constitutional lesson that wars require clear authority, clear objectives, and public accountability.
American military strength helped prevent a third world war among great powers.
American naval power has protected free navigation and global commerce.
America’s military greatness is highest when joined to constitutional restraint, national interest, and defense of liberty against tyranny.
IX. International Charity, Humanitarian Help, and Global Influence
America has been one of history’s most generous nations in private charity.
American churches, charities, civic groups, and citizens have sent food, medicine, disaster relief, and missionaries across the world.
American generosity is strongest when voluntary, local, religious, and civic institutions lead the work.
The United States has provided major humanitarian relief after wars, famines, earthquakes, floods, and epidemics.
American medical missions have brought care to people in remote and suffering regions.
American agriculture and food aid have helped relieve hunger abroad.
American disaster relief has often shown the compassion of a free and prosperous people.
Foreign aid is most constitutionally defensible when authorized by Congress, transparent, limited, and tied to legitimate national interests or humane relief.
The Marshall Plan helped rebuild Western Europe after World War II and resisted communist expansion.
American assistance helped transform former enemies such as Germany and Japan into peaceful, productive, constitutional allies.
America’s example inspired dissidents living under communist regimes.
American broadcasting, literature, religion, and culture carried messages of liberty behind the Iron Curtain.
America supported the moral cause of those resisting Soviet domination in Eastern Europe.
The United States helped create a global contrast between free enterprise and communist control.
America’s constitutional example influenced reformers seeking limited government and individual rights.
America’s universities became magnets for students from across the world.
American scientific cooperation benefited humanity beyond national borders.
American medical breakthroughs became global blessings.
American food production and logistics helped stabilize regions in crisis.
American voluntary associations showed the world that civil society can do what government alone cannot.
America’s influence is most noble when it comes through example rather than coercion.
America’s constitutional model inspired written constitutions, bills of rights, and republican institutions abroad.
America’s defense of religious liberty gave hope to persecuted believers worldwide.
America’s culture of private giving reflects the moral strength of a free people.
The United States has helped the world most when it has combined strength, charity, commerce, faith, and constitutional restraint.
X. Culture, Assimilation, National Character, and Civilizational Influence
America’s culture is powerful because it is built around liberty, responsibility, work, faith, and opportunity.
The American Dream teaches that birth need not determine destiny.
America’s national identity is constitutional rather than tribal.
The melting pot succeeded when immigrants assimilated into a shared civic order.
America has welcomed people from many nations and made them citizens of one republic.
The English language, common law inheritance, constitutional education, and civic rituals helped unify a diverse people.
American religious liberty allowed many faiths to flourish without a national church.
Churches and religious communities helped build schools, hospitals, charities, and moral culture.
The American family has been a foundation of work, education, sacrifice, and citizenship.
Local communities, not distant bureaucracies, formed much of America’s civic strength.
American literature, music, film, and art projected themes of freedom, courage, redemption, and self-government.
Jazz, country, rock, gospel, blues, and other American music forms shaped global culture.
American film and television carried images of freedom, justice, enterprise, and individual courage around the world.
American sports celebrate competition, discipline, excellence, teamwork, and merit.
American universities, libraries, museums, and publishers became centers of learning and debate.
American journalism at its best challenges power and informs citizens.
American humor, optimism, and confidence reflect a people accustomed to freedom.
American culture prizes invention, reinvention, and second chances.
America’s frontier spirit encouraged courage, endurance, and practical problem-solving.
American patriotism is rooted not merely in land or blood, but in gratitude for liberty under God and law.
America’s greatest heroes include founders, soldiers, abolitionists, inventors, astronauts, entrepreneurs, pastors, teachers, parents, and ordinary citizens.
America has influenced the world through its Constitution, economy, military strength, science, charity, culture, and example.
America’s failures are real, but its founding principles provide the standard by which those failures are condemned.
The United States is not great because it is perfect; it is great because it was founded on truths greater than government and built a constitutional system capable of correction.
The United States is the greatest nation to ever exist because it uniquely joined God-given rights, written constitutional limits, federalism, ordered liberty, economic power, military strength, scientific achievement, cultural influence, charity, and lawful self-correction into one enduring republic.
the Conservative TAKE
America’s greatness has never rested merely in wealth, military strength, geography, or cultural influence, though it has possessed all of these in extraordinary measure. Its true greatness rests in something deeper: the founding conviction that rights come from God, not government; that power must be limited because man is imperfect; that liberty requires virtue; and that a free people can govern themselves under a written Constitution.
The United States is not great because it has always been perfect. It is great because its founding principles provide the standard by which its failures can be judged and corrected. No nation has more clearly declared that government exists to secure pre-existing human rights, no Constitution has more successfully restrained power across time, and no people have done more to prove that ordered liberty can endure at continental scale.
To preserve America, we must preserve the Constitution as written, the liberties it protects, the federal system it designed, and the moral truths on which the republic was built. The future of the nation depends not on abandoning its founding, but on returning to it.