the Conservative TAKE
Politics • Culture • News
Ten Strong Indicators Trump Is Poised for Victory in 2024
November 02, 2024
post photo preview

This analysis draws from the insights shared on the Substack of Seth Keshel, MBA. A former Army Captain of Military Intelligence and Afghanistan veteran, Keshel is renowned worldwide for his analytical method of election forecasting. His work, which has been commended by President Donald J. Trump, offers a detailed perspective on voter trends and electoral shifts. Here is a look at ten key indicators suggesting Trump is well-positioned for a strong performance in the 2024 election.


1. Trump’s Narrative Control

Donald Trump’s campaign has evolved significantly since the chaotic 2020 election. While he had the votes to win then, he struggled to control the narrative. The relentless media attacks, amplified narratives of pandemic-era irresponsibility, and doubts about election integrity drowned out his message. Today, Trump has become a master of the media landscape, transforming even setbacks into publicity wins. He has handled assassination threats, legal battles, and media smears with the finesse of a seasoned showman, making appearances from Joe Rogan to local rallies, and even turning his mugshot in Atlanta into a viral sensation. His relatable moments, like serving fries at McDonald's and donning blue-collar attire, have only boosted his visibility and likability. This time, should he claim victory, few would question its legitimacy.

Conversely, Kamala Harris faces an uphill battle, reliant on institutional allies and a media network that seems increasingly hesitant to lend unconditional support. Without Trump-level visibility or grassroots enthusiasm, her candidacy looks fragile, with her campaign banking on media-driven miracles and established connections.


2. Shifts in Party Affiliation

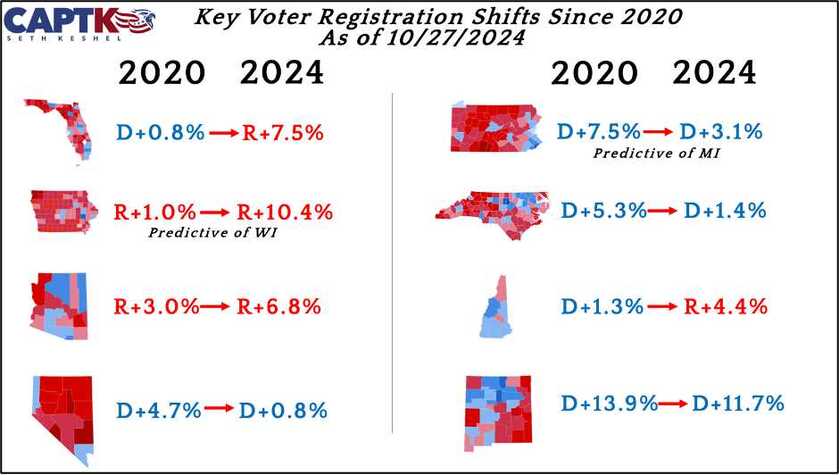
The electoral map has changed drastically since 2020, with party registration trends favoring the GOP. Out of 31 states that register voters by party, 30 have either become more Republican or less Democratic. The sole outlier, Colorado, is moving leftward. This trend is especially pronounced in battleground states like Pennsylvania, Arizona, Nevada, North Carolina, and New Hampshire, which have seen marked shifts toward the GOP. Furthermore, Florida and Iowa—peripheral battlegrounds—are leaning much more Republican.

Pennsylvania stands out the most, with 64 of its 67 counties shifting toward the GOP, yielding a net advantage of over 400,000 voters since 2020. Meanwhile, Gallup reports the most Republican-leaning political environment since 2004.

Captain K's Corner


3. Striking Early Voting Dynamics

Donald Trump’s call for Republicans to embrace early voting was strategic, aimed at influencing the media narrative. Traditionally, Democrats have relied on early vote leads to demoralize GOP turnout efforts. Yet this cycle tells a different story: Republicans are either leading or seeing more favorable returns. North Carolina’s early voting has a clear GOP edge. Arizona shows a Republican lead exceeding 155,000 ballots. Nevada has Republicans up over 5% in early returns. Georgia’s demographic data suggests strong rural white turnout, while black voter participation in key urban areas is notably low, a pattern unlikely to improve on Election Day.

Pennsylvania’s early voting dynamics are also favorable for the GOP, with returns showing a 20% shift toward Republicans compared to the 2020 race, where Joe Biden barely eked out a win.


4. Miami-Dade: A GOP Bellwether

Miami-Dade County is poised to make history. Currently, early voting turnout is favoring Republicans by 5%, a stunning reversal from its D+3.4% registration index. If Trump wins here, it would mark the first GOP presidential victory in Miami-Dade since 1988. Historically, whenever a Republican presidential nominee carries this county (as seen in elections from 1928 to 1988), they have gone on to win the presidency. This shift signals a seismic change in the Sunshine State’s electoral landscape.


5. The Duval County Indicator

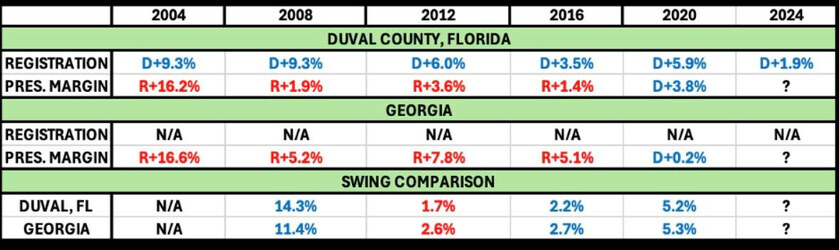
Another key signal in Florida comes from Duval County, home to Jacksonville. This area has historically mirrored Georgia in voting patterns and demographics. Registration in Duval has shifted from D+5.9% in 2020 to just D+1.9% today. Current turnout trends have Republicans leading by 3.5%. If Trump carries Duval, it’s a strong indicator he could also reclaim Georgia and its crucial 16 electoral votes.

Captain K's Corner

6. Early Signs in New York

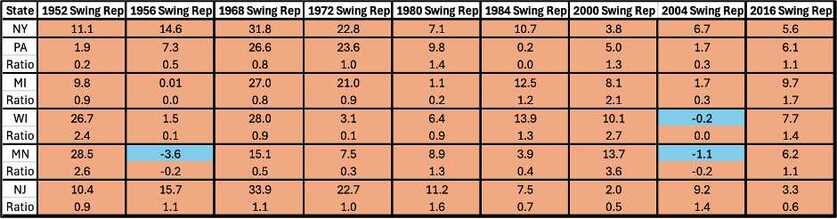
While presidential elections differ from midterms, New York is showing undeniable signs of a Republican shift. Registration data and unexpectedly competitive races in 2022 hint at a changing political tide. Even though some recent polls show Harris with a wide lead, between August and October, several showed her advantage shrinking to single digits. Historically, when New York trends right, states like Pennsylvania, Michigan, Wisconsin, Minnesota, and New Jersey tend to follow. This suggests that the whole Rust Belt could be shifting in Trump’s favor.

https://skeshel.substack.com/p/watch-new-york-2024s-potential-canary

7. Peripheral Indicators and Betting Markets

Beyond voter data, other measures highlight GOP momentum. Betting platforms like PolyMarket and Kalshi show increased confidence in a Republican victory. Additionally, youth polling data, aligned with early voting trends, indicates a surge of support for the GOP among Generation Z, reminiscent of the Reagan-era youth shift in 1984. Democrats’ overreach on progressive issues may have triggered a rebellion among young voters they once counted on.


8. Urban Turnout Disparities

One of the Democrats’ biggest worries is the uneven turnout in urban areas. The traditional male-female voting split has widened to 44/56, as opposed to the typical 48/52. This is concerning for Democrats, whose success depends heavily on mobilizing urban centers. Across key locations, like Fulton County, Georgia, and major cities in Texas, turnout lags behind expectations. Black voter participation has notably declined, and Hispanic support is bleeding to the GOP. Without extraordinary turnout in urban strongholds, Democrats face a steeper climb than in 2020.


9. The Polling Conundrum

Polling remains a polarizing topic, even as reputable firms like Rasmussen and Big Data Poll (Richard Baris) strive for accuracy. Trump currently leads the RealClearPolitics popular vote average by 0.5%, with most battleground states showing favorable trends. Mainstream polls have a history of underestimating Trump’s support, with Wisconsin polls missing by an average of six points in 2020. Minority support for Trump is projected to break GOP records, and early registration data suggests massive gains among non-college-educated white voters.


10. Shifting Endorsements

Remarkably, even traditionally left-leaning newspapers are hesitating to endorse Harris. Outlets like The Washington Post and The Los Angeles Times, loyal to Democrats in past cycles, have remained silent, reflecting doubts about her viability. Their refusal to endorse speaks volumes, given their history of backing Democratic nominees even in contentious races. Like pollsters, these editorial boards may be wary of aligning with a candidate perceived as a potential loser.

community logo
Join the the Conservative TAKE Community
To read more articles like this, sign up and join my community today
0
What else you may like…
Videos
Posts
Articles
Odds of Love: A Probability Study Proving Jasmine Crockett’s Race Baiting Ignores the Real Challenges of Finding a Conservative Black Match

EXECUTIVE SUMMARY

Representative Jasmine Crockett’s recent criticism of Representative Byron Donalds for marrying a white woman highlights a regressive mindset steeped in ignorance and racial bias, casting doubt on her ability to engage with the diverse realities of American life.

https://x.com/EricLDaugh/status/1906302926571618409

By implying that Donalds has been “whitewashed” through his interracial marriage, Crockett clings to outdated stereotypes that dictate racial loyalty over personal agency, exposing her own hypocrisy in advocating for equality while policing others’ private choices. This narrow perspective stands in stark contrast to the evolving dynamics of relationships across racial lines, as evidenced by a probabilistic analysis of partner selection among conservative Black individuals. To illustrate the complexity of such dynamics, consider the following study estimating the likelihood of a conservative Black man finding and marrying a conservative Black woman who aligns with his values—a scenario Crockett might deem more “acceptable,” yet one fraught with its own...

00:00:46
00:01:20
Biblical Citizenship in Modern America Commentary Ep14 - Understanding the Times 3

00:00 Introduction
02:03 Week 13 review
04:56 Our Current Education System
05:59 Six Verbs for Advancing Truth in the Country
09:08 What Our Elected Officials Don't Know About America
10:44 The Foundation of Law
12:12 Who Were the Signers of the Declaration of Independence?
13:52 Benjamin Rush
15:44 What is Patriotism?
18:34 Summary of Workbook

00:25:36
2026-03-18-substack-massie-sucks-20-plus-reasons

Thomas Massie is fake MAGA. This Trump hater was eager to shoot Trump supporters on J6, endorsed DeSantis while calling MAGA a virus, and now dodges mass deportations. Here are the sources that support our Substack note entitled "20+ Reasons Thomas Massie Why He Sucks (aka fake MAGA)"

2026-03-18-substack-massie-sucks-20-plus-reasons.pdf
MN: ICE is not LEAVING

The left is trying to make it seem like Trump is abandoning Minnesota, but that’s misleading. What’s actually happening is that the large-scale “Operation Metro Surge” is being wound down because its primary objectives were met. ICE is now shifting to a more targeted approach...picking up deportable individuals directly from prisons and jails or at the point of release...so the massive street-level surge is no longer necessary.
Tom Homan announced on February 12, 2026, that he proposed ending the surge operation, and Trump agreed. But that doesn’t mean enforcement is stopping. It means it’s transitioning from a peak deployment of thousands of agents to a smaller, more focused presence...closer to normal staffing levels.
The operation resulted in over 4,000 arrests, many involving individuals with criminal records. Homan also emphasized improved cooperation with Minnesota state and local authorities, giving ICE greater access to county jails and state prisons. That ...

post photo preview
Yes. Americans Are Saving More From Trump Policies Than They’re Losing to Gas Prices
A Milton Friedman Style Analysis of Taxpayer Savings vs. Rising Energy Costs (2024–2026)


Executive Summary

Public debate often focuses on headlines—tax cuts, gas prices, deficit claims—but misses the only question that actually matters to working Americans:

👉 Are you better off financially?

This paper answers that question using a clear, measurable test:

👉 Is the average taxpayer saving more per year from recent policy changes than they have lost due to higher gas prices over the past two years?

Using available economic data—analyzed with assistance from Grok—the conclusion is straightforward:

Yes. On average, taxpayer savings exceed increased fuel costs by a wide margin.

This analysis is grounded in the principles of Milton Friedman, who argued that economic policy should be judged not by intentions or rhetoric, but by outcomes:

Does it leave more money, freedom, and incentives in the hands of individuals—or does it expand government control?

Recent policy changes—including tax reductions, deregulation, and expanded domestic energy production—have shifted resources back toward the private sector. These changes have:

  • Increased take-home income through tax relief
  • Reduced hidden costs through deregulation
  • Strengthened incentives to work, invest, and produce

At the same time, Americans have faced real cost pressures:

  • Rising gas prices driven largely by global instability
  • Persistent inflation reducing purchasing power
  • Elevated interest rates increasing borrowing costs

When measured directly:

  • Taxpayer savings: ~$2,300–$2,900 annually
  • Gas cost increases: ~$400–$600 annually

👉 Savings exceed gas costs by roughly 4 to 6 times

After accounting for all major cost pressures:

👉 The average household is still modestly ahead—by approximately $100–$400 per year

This represents a net positive outcome, though not a dramatic one.

From a Friedman perspective, the direction is correct—toward freer markets and stronger incentives—but incomplete. Without meaningful spending restraint and stable monetary policy, these gains remain vulnerable over time.


1. Policy Framework and Structural Changes

The economic landscape over the past two years has been shaped by a combination of legislative and executive actions, most notably the:

One Big Beautiful Bill Act (OBBBA, H.R. 1 – July 4, 2025)

Key provisions include:

  • Permanent extension of 2017 tax cuts
  • Lower marginal tax rates
  • Increased standard deduction
  • Adjustments to the child tax credit
  • New deductions for tips and overtime income (with caps)
  • Expanded deductions for seniors
  • Temporary increase in the SALT deduction cap
  • Full or expanded business expensing

These tax changes were paired with broader structural efforts:

  • Energy deregulation (federal land access, faster permitting)
  • Reduction in regulatory burdens across industries
  • Reported $600 billion deficit reduction
  • Reduction of approximately 352,000 federal employees

Together, these policies aim to reduce government friction and increase private-sector productivity.


2. Real-World Impact on the Average Taxpayer

To understand the effects, we define the average taxpayer as:

  • Household income: ~$80,000–$85,000
  • Annual spending: ~$60,000–$65,000
  • Driving: ~13,000–14,000 miles per year

Direct Benefits

  • Tax Relief:
    Meaningful and measurable. Most households see increased take-home income.
  • Incentive Effects:
    Lower marginal rates encourage additional work, investment, and productivity.

Cost Pressures

  • Gas Prices:
    Increased due to geopolitical instability, not domestic production limits.
  • Inflation:
    ~3.3% annually, eroding purchasing power across all categories.
  • Interest Rates:
    Elevated borrowing costs for mortgages, auto loans, and credit cards.

Indirect Benefits

  • Deregulation:
    Reduces compliance costs → lowers prices indirectly.
  • Energy Production:
    Increased domestic supply reduces long-term cost pressures across the economy.

3. Hidden Economic Forces (Friedman Lens)

Friedman emphasized that the most important economic effects are often the least visible.

Inflation as a Hidden Tax

Inflation reduces real income without legislative approval.

  • ~3.3% inflation = ~$2,000+ annual loss in purchasing power

Energy as a System-Wide Cost Driver

Energy affects:

  • Transportation
  • Food production
  • Manufacturing
  • Supply chains

Lower energy costs ripple through the entire economy.


Deficit Spending

Persistent deficits:

  • Increase future tax burdens
  • Push interest rates higher
  • Crowd out private investment

4. Energy Policy and Market Response

Recent policy changes significantly expanded domestic energy production:

  • Record natural gas output (118.5 Bcf/day)
  • Strong oil production (~13.6M barrels/day)

Impact:

  • Reduced supply constraints
  • Lower embedded costs in goods and services
  • Increased economic stability

Gas Price Reality:

Recent increases are largely due to external geopolitical shocks, not domestic policy failure.

👉 Without increased domestic supply, prices would likely be higher.


5. The $600 Billion Deficit Claim — Reality Check

The reported deficit reduction is often misunderstood.

Key Findings:

  • Driven primarily by increased revenue, not spending cuts
  • Federal deficit remains near $1.9 trillion
  • Long-term debt continues to rise

👉 Conclusion:
This is not structural deficit reduction—it is temporary improvement driven by economic growth and taxation.


6. Financial Breakdown: Average Household Impact

Annual Impact (2026 Estimates)

CategoryAnnual ImpactExplanation
Direct Tax Savings+$2,300–$2,900Increased take-home income
Indirect Savings+$200–$500Lower regulatory & energy costs
Total Gains+$2,500–$3,400 
Gas Cost Increase–$400–$600Based on ~520 gallons/year
Inflation Impact–$2,000–$2,150Loss of purchasing power
Borrowing Costs–$200–$400Higher interest rates
Future Debt Burden–$300–$500Long-term economic drag
Total Costs–$2,900–$3,650 
Net Effect–$400 to +$500Central estimate: +$100–$300

7. Government Size and Economic Efficiency

  • Federal workforce reduced by 352,000 employees
  • Lowest level since 1966

Interpretation:

  • Indicates reduced administrative burden
  • Suggests improved efficiency

However:

👉 True government size = spending + regulation + mandates

Workforce reduction alone does not guarantee long-term fiscal discipline.


8. Core Question: Savings vs. Gas

👉 Has the increase in gas costs exceeded taxpayer savings?

Data-Based Answer:

  • Tax savings: $2,300–$2,900
  • Gas increases: $400–$600

👉 No. Savings exceed gas costs by 4–6 times.


9. Final Conclusion

👉 Has the increase in gas costs (based on average miles driven per taxpayer) been greater than the average tax savings per taxpayer?

No.

  • Average tax savings: $2,300–$2,900 per year
  • Average gas cost increase: $400–$600 per year

👉 Taxpayer savings exceed increased gas costs.


👉 Is the average American better off?

Yes.


Sources for the Analysis (Mid-2024 to April 2026 U.S. Economic Policy)All figures, deficit claims, tax impacts, energy production data, CPI readings, and workforce reductions cited in the analysis are drawn directly from official government reports, nonpartisan fiscal watchdogs, and primary data agencies. Here is the complete list with full URLs (plain text only, no clickable links):
  1. IRS Official Guidance on One Big Beautiful Bill Act (OBBBA) Provisions
    https://www.irs.gov/newsroom/one-big-beautiful-bill-provisions
  2. Tax Foundation – FAQ: The One Big Beautiful Bill, Explained (full tax changes and dynamic scoring)
    https://taxfoundation.org/research/all/federal/one-big-beautiful-bill-act-tax-changes/
  3. Tax Foundation – OBBBA Average Tax Cuts Impact Map ($2,300 average individual tax cut in 2026)
    https://taxfoundation.org/data/all/federal/obbba-average-tax-cuts-impact-map/
  4. Committee for a Responsible Federal Budget (CRFB) – Breaking Down the One Big Beautiful Bill (deficit impact: +$2.4T primary, +$3T with interest)
    https://www.crfb.org/blogs/breaking-down-one-big-beautiful-bill
  5. Congressional Budget Office (CBO) – Monthly Budget Review: January 2026 ($696 billion deficit first four months FY2026; revenue-driven slowdown)
    https://www.cbo.gov/publication/61977
  6. Bipartisan Policy Center – Deficit Tracker (January 2026 cumulative deficit $600 billion YoY lower after timing adjustments)
    https://bipartisanpolicy.org/report/deficit-tracker/
  7. CBO – The Budget and Economic Outlook: 2026 to 2036 (full-year FY2026 deficit projection $1.9T)
    https://www.cbo.gov/publication/62105
  8. U.S. Energy Information Administration (EIA) – U.S. natural gas production reached a new record in 2025 (118.5 Bcf/d)
    https://www.eia.gov/todayinenergy/detail.php?id=67345
  9. Bureau of Labor Statistics (BLS) – Consumer Price Index Summary, March 2026 (3.3% YoY CPI, energy +10.9%, gasoline +21.2%)
    https://www.bls.gov/news.release/cpi.nr0.htm
  10. Pew Research Center – Federal workforce shrank 10% in Trump’s first year back in office (net reductions and context)
    https://www.pewresearch.org/short-reads/2026/03/13/federal-workforce-shrank-10-in-trumps-first-year-back-in-office/
  11. Office of Personnel Management (OPM) – Workforce Changes Data (net -271k to -352k civilian reductions FY2025, lowest headcount since 1966)
    https://data.opm.gov/explore-data/analytics/workforce-changes
  12. CRFB / CBO cross-referenced OBBBA fiscal cost estimates (used for hidden future burden and crowding-out calculations)
    https://www.crfb.org/blogs/breaking-down-one-big-beautiful-bill
    (links directly to CBO scoring tables)
Read full Article
DRAFT: GOP Takes Over the Senate Floor: SAVE Act Fight Begins
Inside the strategy, the backup plans, and the path to getting it to Trump’s desk

Something significant is unfolding in the United States Senate—and it deserves sober, clear-eyed attention.

As of today, the Senate has formally taken up debate on the SAVE Act (Safeguard American Voter Eligibility Act), a bill that already passed the House and now faces its most difficult test: the Senate’s procedural gauntlet. At its core, the legislation is straightforward. It requires proof of citizenship to register to vote and government-issued ID to cast a ballot in federal elections. In other words, it seeks to enforce what is already embedded in federal law: that only citizens may vote.

Only for Supporters
To read the rest of this article and access other paid content, you must be a supporter
Read full Article
DRAFT - A Necessary Decision: Why the Iran War Was a Risk Worth Taking

The current conflict with Iran did not emerge out of political convenience or election-year calculation. According to reporting and analysis discussed by Bill O’Reilly and Glenn Beck, the decision was driven by intelligence assessments that suggested Iran was approaching a dangerous threshold in its nuclear program and had definitively rejected negotiations to halt it.


Only for Supporters
To read the rest of this article and access other paid content, you must be a supporter
Read full Article
See More
Available on mobile and TV devices
google store google store app store app store
google store google store app tv store app tv store amazon store amazon store roku store roku store
Powered by Locals